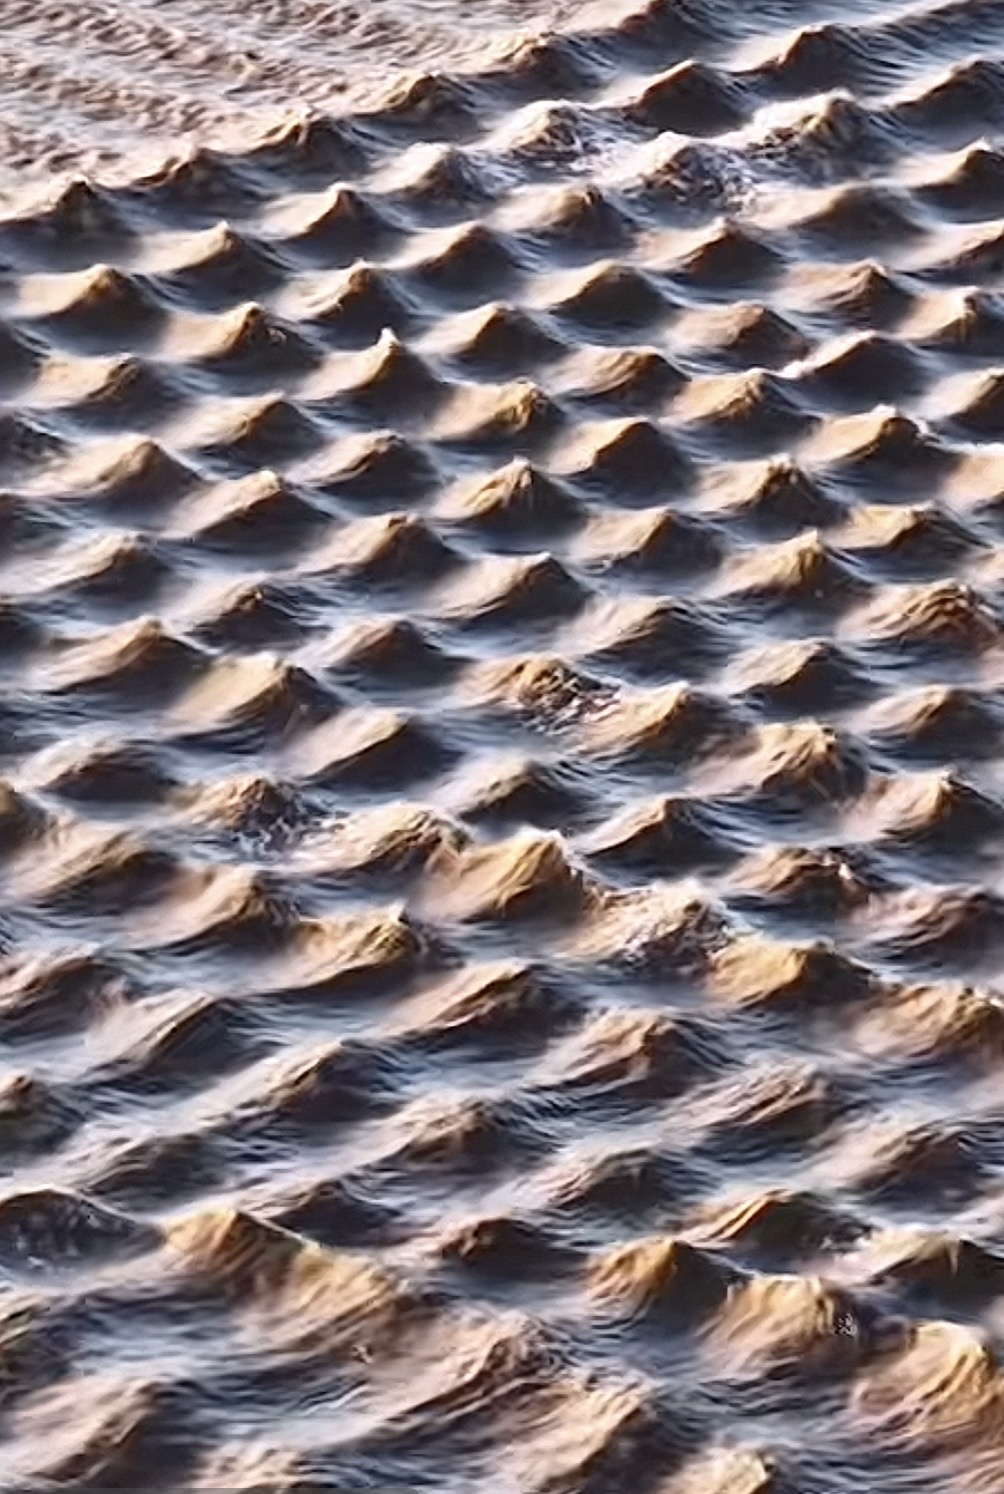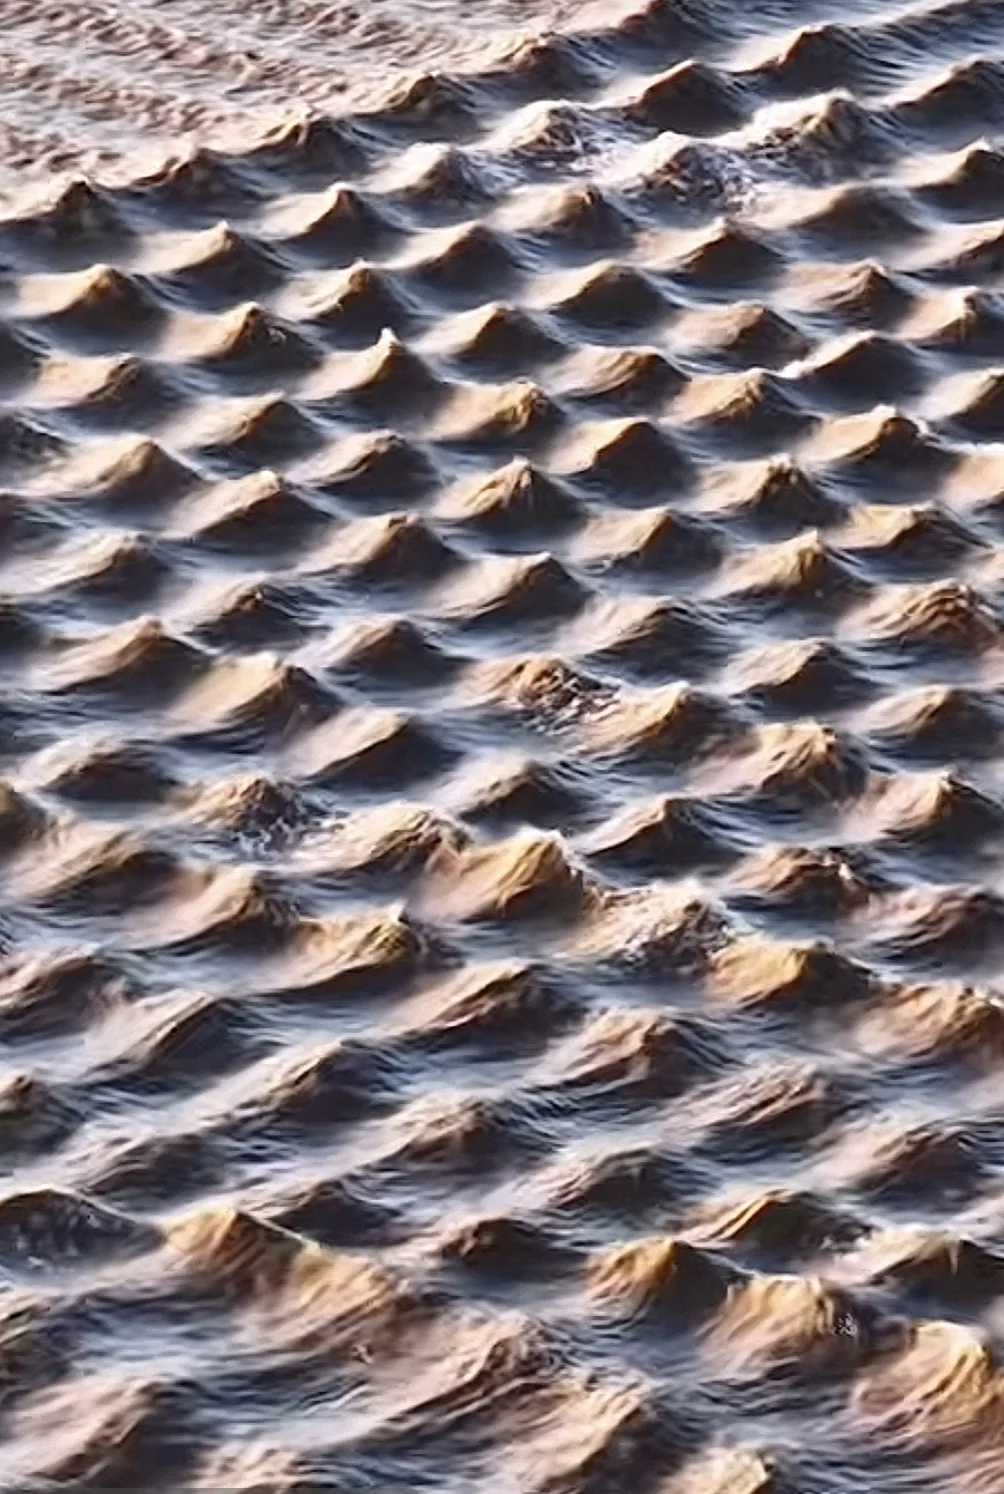
The striking feature of this image is not simply its regularity. Two continuous systems of waves meet, and their combined surface presents a grid of apparently discrete peaks. None of those peaks needs to have been carried into the scene as an independent object. Each is produced locally by a relation among propagating modes.
That makes the image worth preserving as a research prompt. It gives a concrete visual form to a general question: under what conditions can continuous modes produce localized structures that remain physically meaningful?
The cross term
A minimal linear model writes two surface modes as
hi(x,t)=Aicos(ki⋅x−ωit+ϕi),i∈{1,2},with the observed displacement
h=h1+h2.The spatial structure becomes especially visible in a quadratic observable. Schematically,
Q∝h2=h12+h22+2h1h2.The cross term 2h1h2 depends on the relative phases of the modes. It can enhance some locations and suppress others, allowing smooth waves to generate a strongly patterned distribution of maxima and minima.
Here Q is only a schematic quadratic proxy. The physical energy density of a water wave also involves kinetic and potential contributions, and an actual cross sea may require directional spectra, finite-depth effects, dissipation, and nonlinear dynamics. The simple expression isolates the mathematical motif; it is not a complete model of the photographed surface.
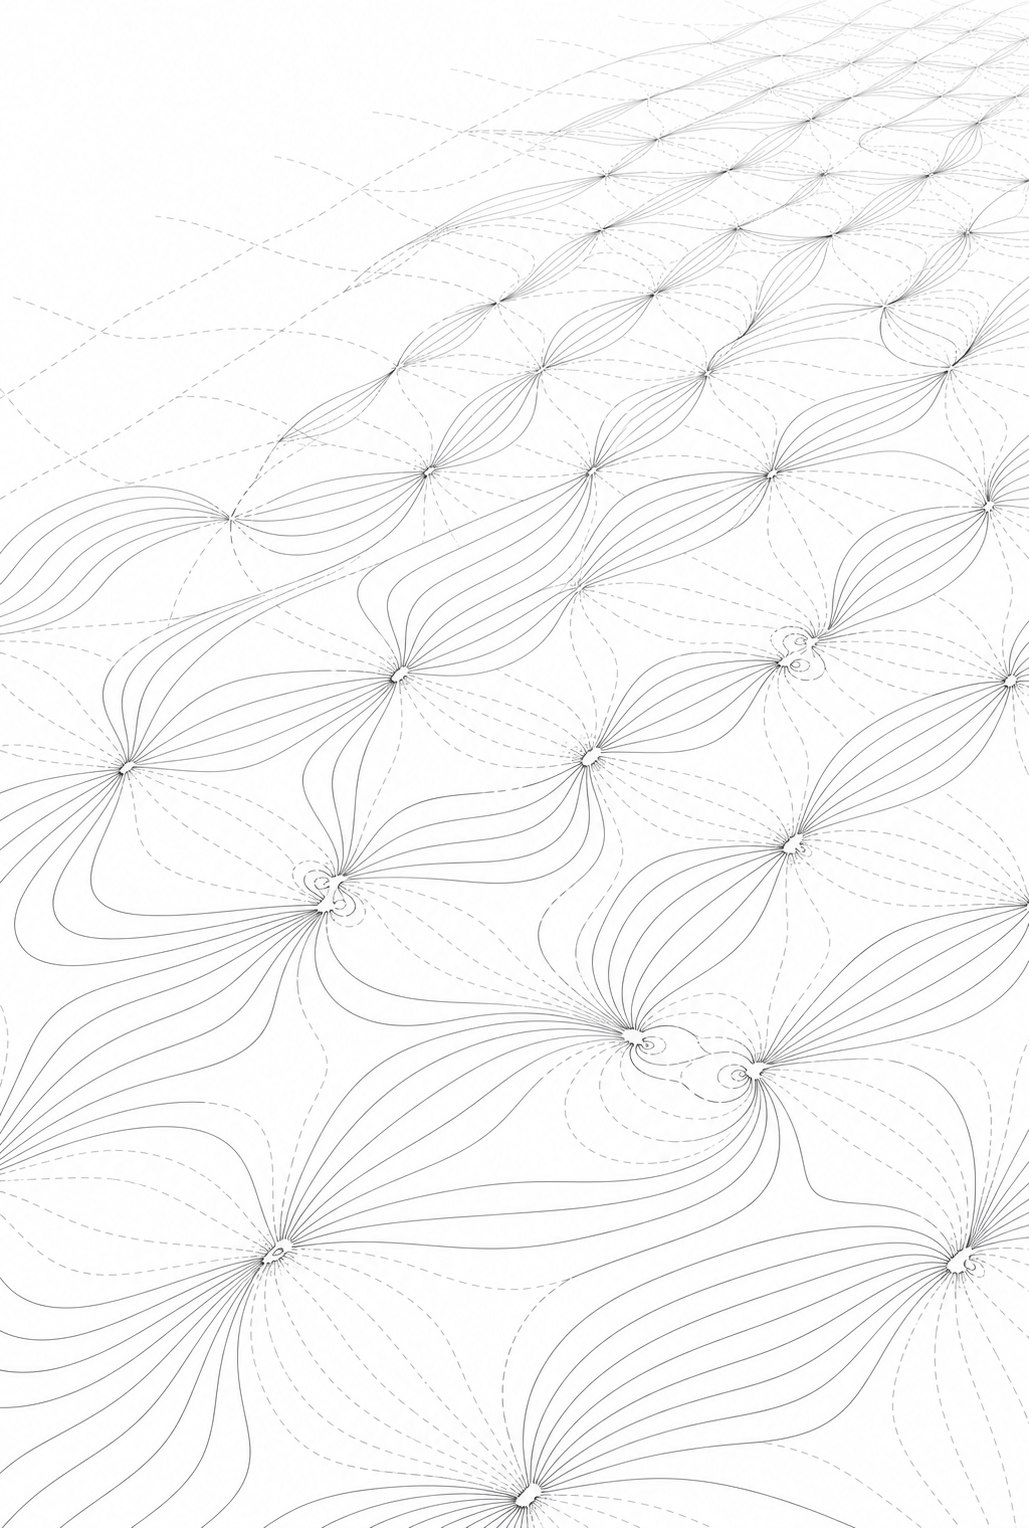
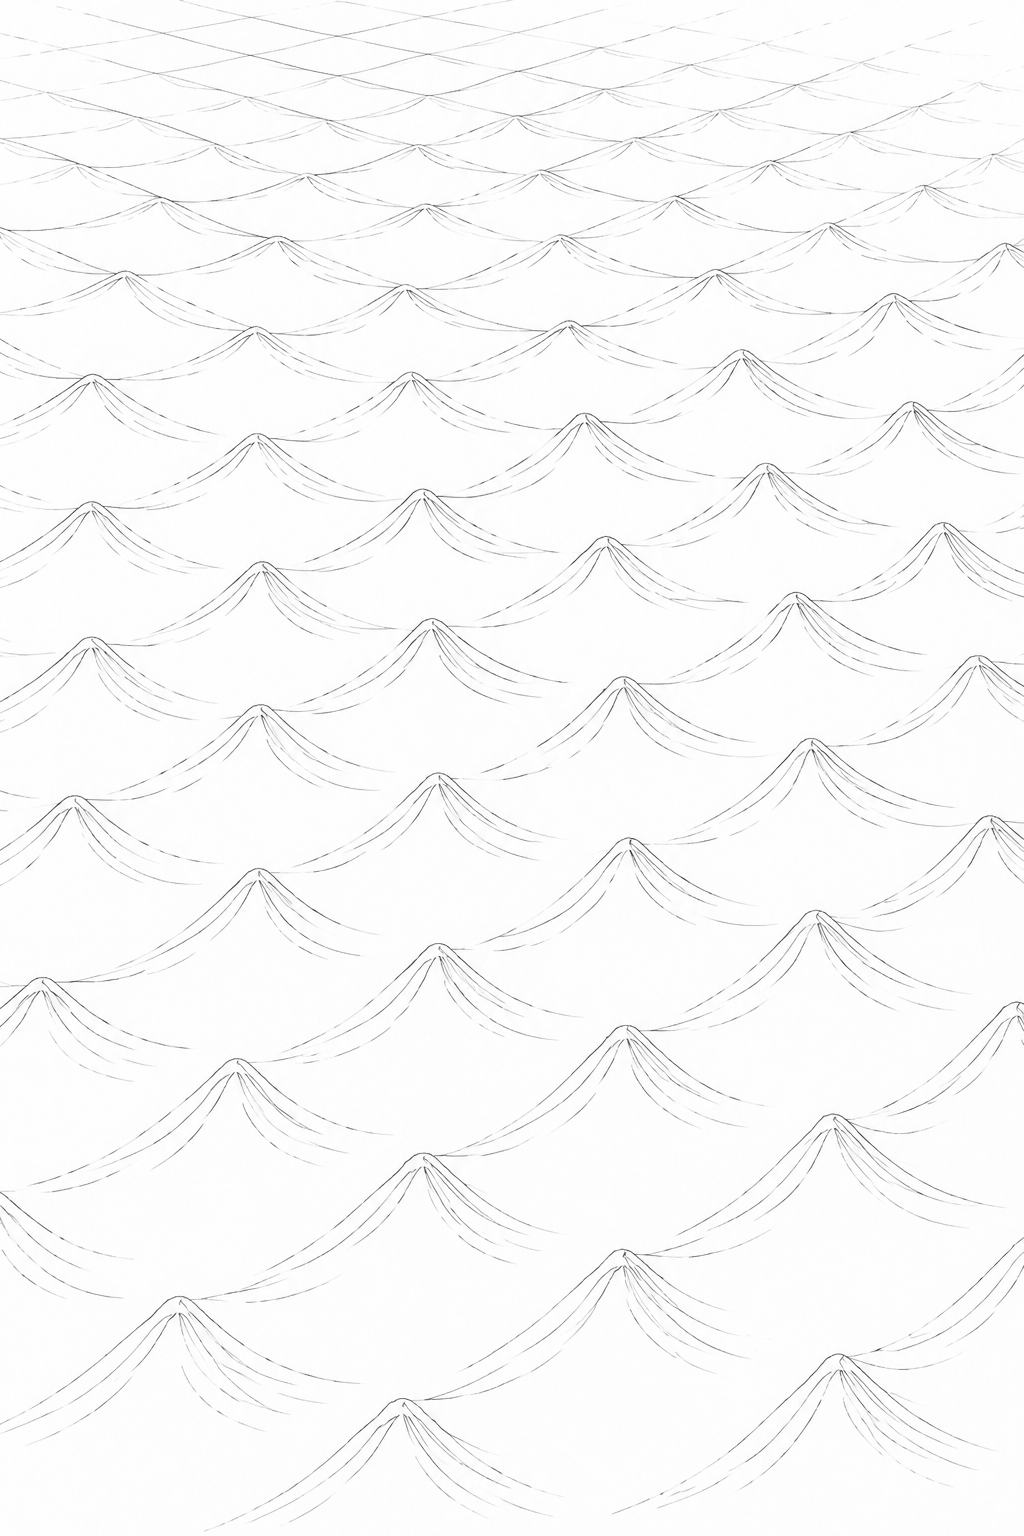
Two interpretive studies
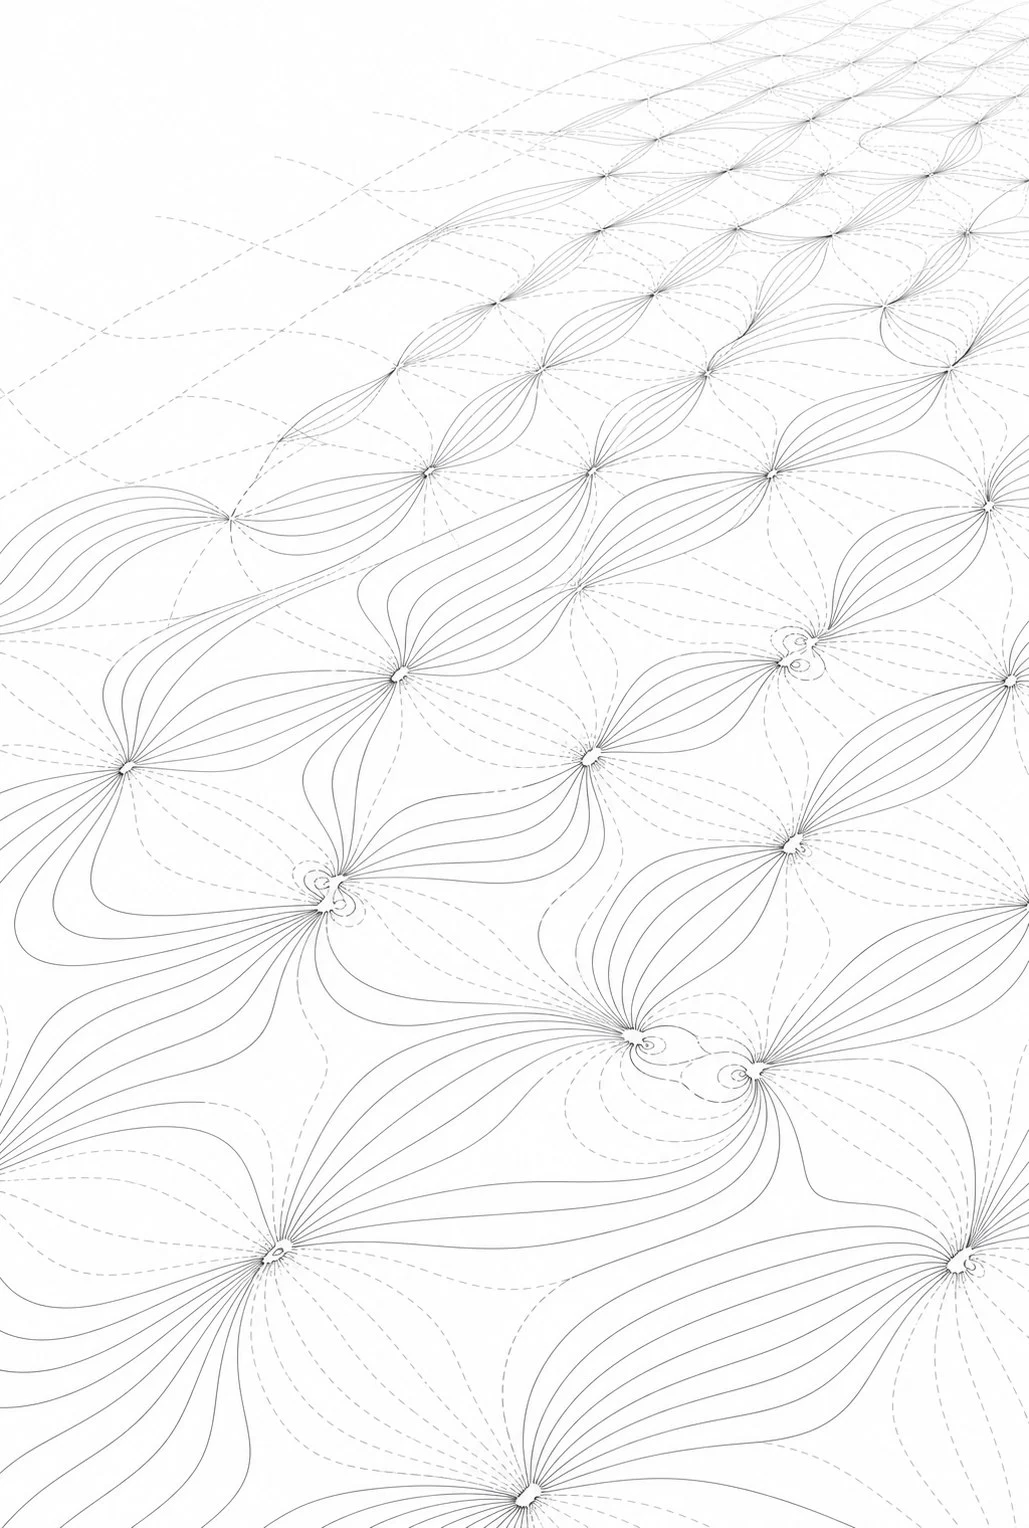
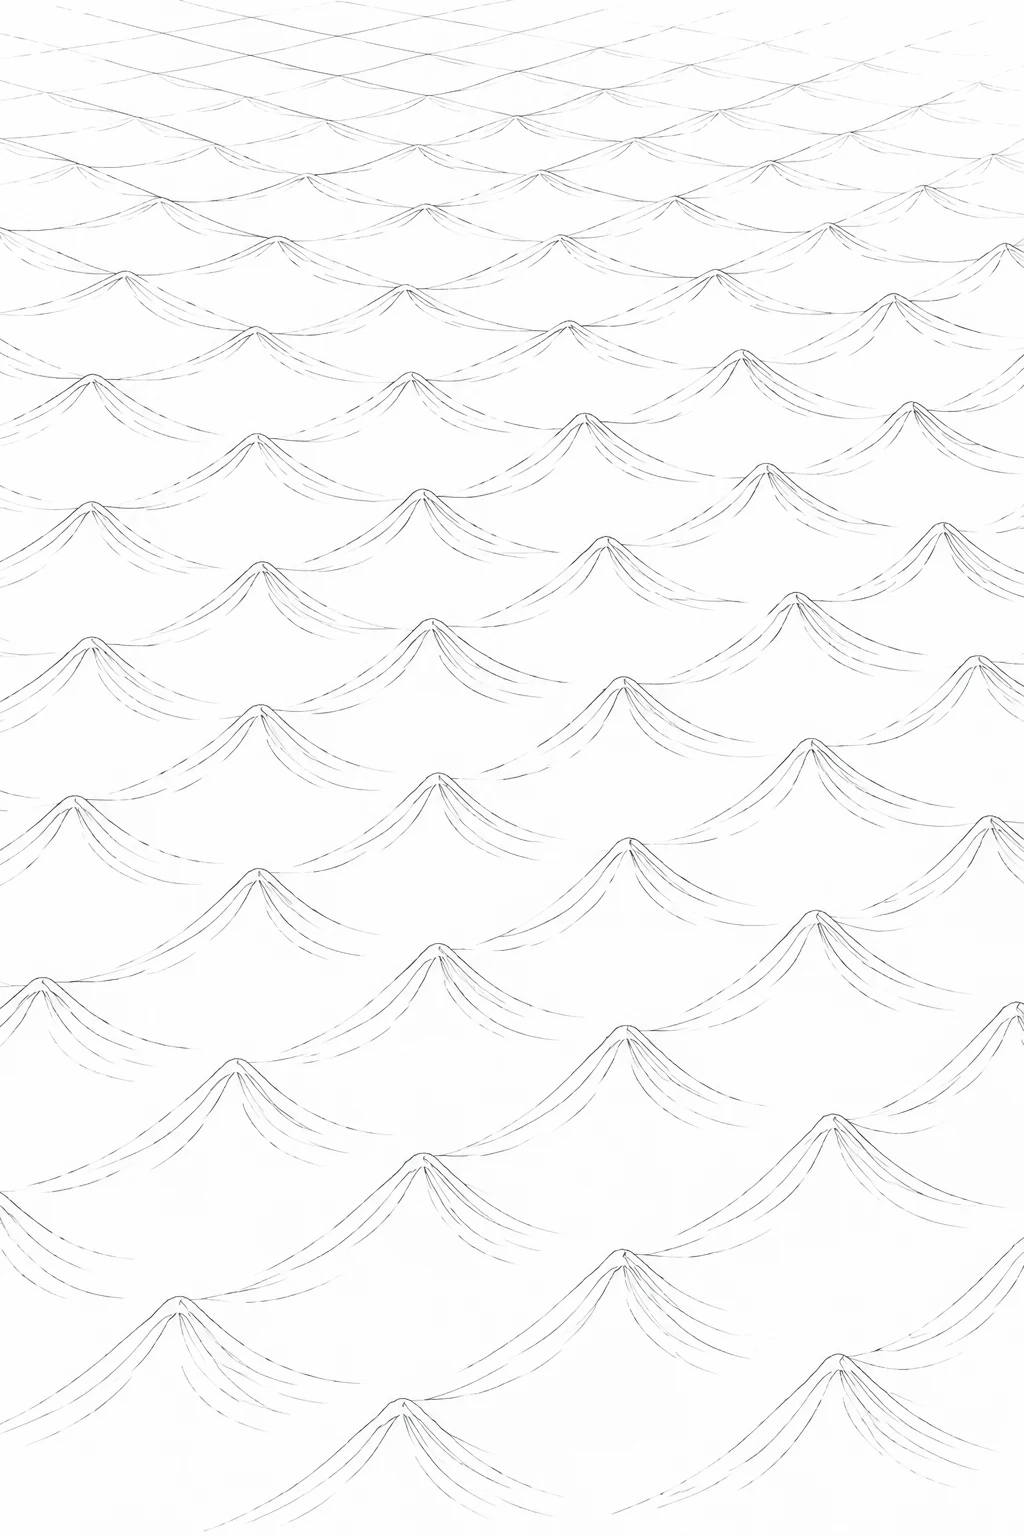
These drawings separate two readings of the same motif: continuous propagation and localized appearance. They are interpretive studies, not calculated field plots or numerical simulations.
Where the analogy stops
The photograph is not an image of a quantum field. Water waves are collective motion in a classical medium; quantum fields require a different mathematical and physical description. A peak in one photograph is also not automatically a stable object. It may move, split, disperse, or disappear as the phases change.
The image therefore does not establish a TEF mechanism, nor does it show that microscopic particles are literally wave peaks. Its value is narrower: it demonstrates, at a familiar macroscopic scale, how continuous modes and their relations can produce localized, discrete-looking structure.
From visual motif to research question
If a future TEF model contains several underlying modes,
Φ=i∑Φi,then the relevant physical question may concern a derived local quantity rather than the field amplitude alone:
σ(x,t)=E[Φ,∇Φ,∂tΦ,…].The useful question is not merely where “a particle” is, but whether σ admits a stable localized solution. Answering it would require a defined dynamics and checks of stability, conservation, response to perturbations, and possibly topology. Until those elements exist, the cross-sea pattern remains an analogy and a prompt for model building.
Localized structure emerging from intersecting continuous modes: a macroscopic analogy for how discrete-looking excitations may arise from an underlying field.
Image record
The observational photograph and first line study were supplied to the TEF archive by Xiaodan Wu. Their original authorship, location, and production details have not yet been established and should be added when confirmed. The second line study was supplied by Xiaodan Wu and generated with ChatGPT on 30 August 2026. Web copies preserve the original dimensions; checksums and file-level provenance are recorded in the accompanying asset manifest.